...
The sample data - we can see that the start and end date appear for every data point. We will simplify this data to produce just a list of employees, their departments.
Steps
Data Cleansing
- Open the Power Query Ribbon
- Click From Table
- First we want to get rid of the data we don't need - so all the tend and start columns
- Just go right ahead and delete the columns - don't be afraid, you won't damage anything!
- Right Click on the column heading > Remove.
- That looks better already
- Now see the side panel to see what it has done.
- It's a good idea to rename Removed Columns to something more descriptive.
- eg Removed date columns
- Now Change M and F to Male and Female
- Right click on the sex column
- Replace Values
- Value to Find = M
- Replace with = Male
- Match entire cell contents = true
- Oops, I made a mistake - I typed replace M with F. Ok that's easy.
- Just click the X next to Replaced Value in the panel and start again
- Oops, another mistake - I typed Femals rater than Female. Easy.
- Just click the cog next to the action in the side panel and make the adjustment
- Again rename your labels in the side panel
- Now, if you have more than a few values you won't use find ad replace.
- Right click on the sex column
- Notice how some steps get combined (eg all the deletions) and some steps get added as each one (eg the replacements).
- At this stage look at the advanced editor so you can see what is happening
- Click Advanced Editor in the ribbon.
- You can edit this, but beware it does get confusing with a big data set.
- Now, let's format the dates
- The date format depends on which data loader you use to do the Import.
- We will use MM\DD\YYYY
- Right click on birthdate
- Choose Change Type > Date > By Locale
- Choose Date then English (United States)
- Do the same for Hiredate
- Remove Salary since Salesforce is not our payroll system
- OK, things are looking pretty good now, it may be time to remove the duplicates.
- You can remove the duplicates based on one or more columns https://support.office.com/en-nz/article/Remove-duplicates-Power-Query-d9cffc69-dc5d-4d94-8b66-72779688874d?ui=en-US&rs=en-NZ&ad=NZ
- In our case we will right click on EmpNo. and choose remove Duplicates.
- At this stage we will close and load and see what we've got.
- Oops! We have lost our Title and Department data.
- Right click on Table 1 in the side panel and click Edit
- Remove the Removed Duplicates action
- Phew! no data lost!
- Now highlight empno deptno and title and choose remove duplicates.
- Easy! Our data now looks like this
...
- Close, but no cigar!
- We still have duplicate titles (as it's sample data, I don't know which one is correct)
- And the department is not on the same row as the titles.
- On deptno and title right click and fill down.
- Now we can remove the duplicates again, but better still, why don't we move the fill down action before the remove duplicates action
- That looks better.
- Now, I'm just going to cheat here and assume that the first row for each is the correct one, so I will now remove duplicates on just the empno column.
- Does this look like something that can be imported into Salesforce yet? Nope, not net.
VLookup
The next step is to replace the deptno with the Salesforce ID of the lookup to the Departments object in Salesforce.
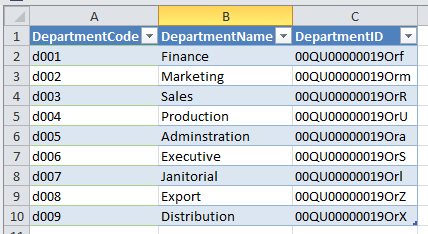
I have a departments spreadsheet
yes, this is made up data and they are lead ID's.
As this is a simple vlookup we are going to use the merge function https://support.office.com/en-nz/article/Merge-queries-Power-Query-fd157620-5470-4c0f-b132-7ca2616d17f9?ui=en-US&rs=en-NZ&ad=NZ but see below for a vlookup on steroids example.
- Add a new source - the Departments file.
- Back on the Employees table choose Merge Queries in the ribbon
- Choose Departments, then choose the deptno and DepartmentCode as the matching columns. Click Ok
- Expand the Table
- Choose only the DepartmentID and to not append the table name
- Voila! The Department ID is there.
- Now remove the column for Deptno.
Getting ready for Salesforce
Now we need to add the data in for the salesforce import.
- Add Column > Add Custom Column
- Name = OwnerID
- Formula ="005U0000000QNtS" (my owner ID).
- Finally, rename the columns (It's up to you if you rename the columns first or last - depending on how bad your data is).
- Right Click on each column > Rename
- Rename them to match the API names of your fields in Salesforce - it makes it easier to add to map in the dataloader.
- Close & Load
Our data ready for Salesforce import
Export
Again a real scenario. My client has KPIs on number of cases answered per month. They want to do a chart to present to management overlaying KPIs with the count of Cases for the year, by quarter. How can you do that in Salesforce. It is virtually impossible (Well, there may be a big hack way of doing it, but I have not found one. The new Charts from Apsona may be able to do it http://apsona.com/pages/sfdc/apsona-charting.html).
...

